Extract and Prepare Location Data
In this lesson, we will focus on extracting the location coordinates of transmitter antennas from a set of .out files. We will start by mapping the .out file extension to a compatible file type supported by Monarch. Next, we'll create a model to extract the location data which we will verify using the Hit Map. After confirming the model, we will apply it to the entire set of .out files. Finally, we will prepare the captured data by using metadata and split operations.
Please watch the video below for a step-by-step demonstration and follow along with the .out files from Imaging.zip.
You'll find more information on millimeter wave imaging and FEKO .out files after the video.
A Brief Background on Millimeter Wave Imaging and FEKO
Millimeter-wave imaging scanners utilize electromagnetic waves in the millimeter-wave spectrum (typically between 30 GHz and 300 GHz) to generate detailed images. These waves can penetrate materials such as clothing, fog, and dust, while being reflected by denser objects like metals or human tissue. This technology is widely employed for detecting concealed items, including weapons, explosives, or contraband, hidden beneath clothing.
In active scanners, antennas transmit and receive millimeter waves as they rotate around a human subject. This scanning process has been simulated using FEKO software, where antennas are modeled as they rotate around the subject. The FEKO simulations generate a series of *.out files corresponding to different angles of rotation and variations in Z-values, capturing the interaction of millimeter waves with the simulated environment.
In a real world scenario, hundreds of .out files will need processing. However, for simplicity, we’ll focus on extracting data from just 8 .out files.
FEKO .out Files
Now, let’s explore the structure of an .out file. These files are far from uniform. They contain multiple sections with different formats. Some sections are non-tabular, while others present tabular data that may not align with other tables.
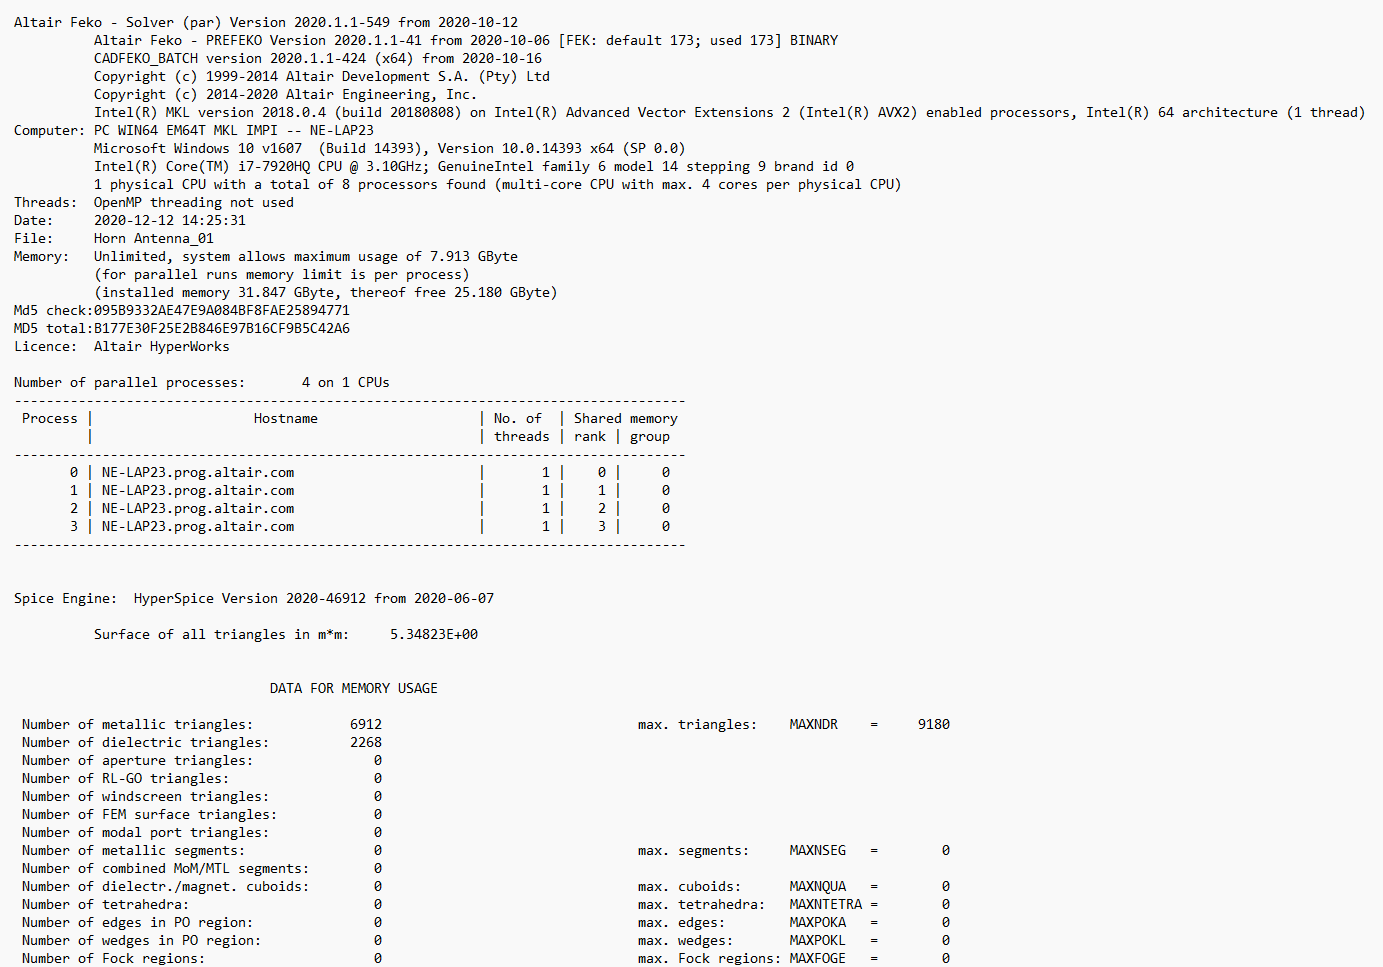
For example, location data appears in the section labeled Data for Waveguide Ports, …
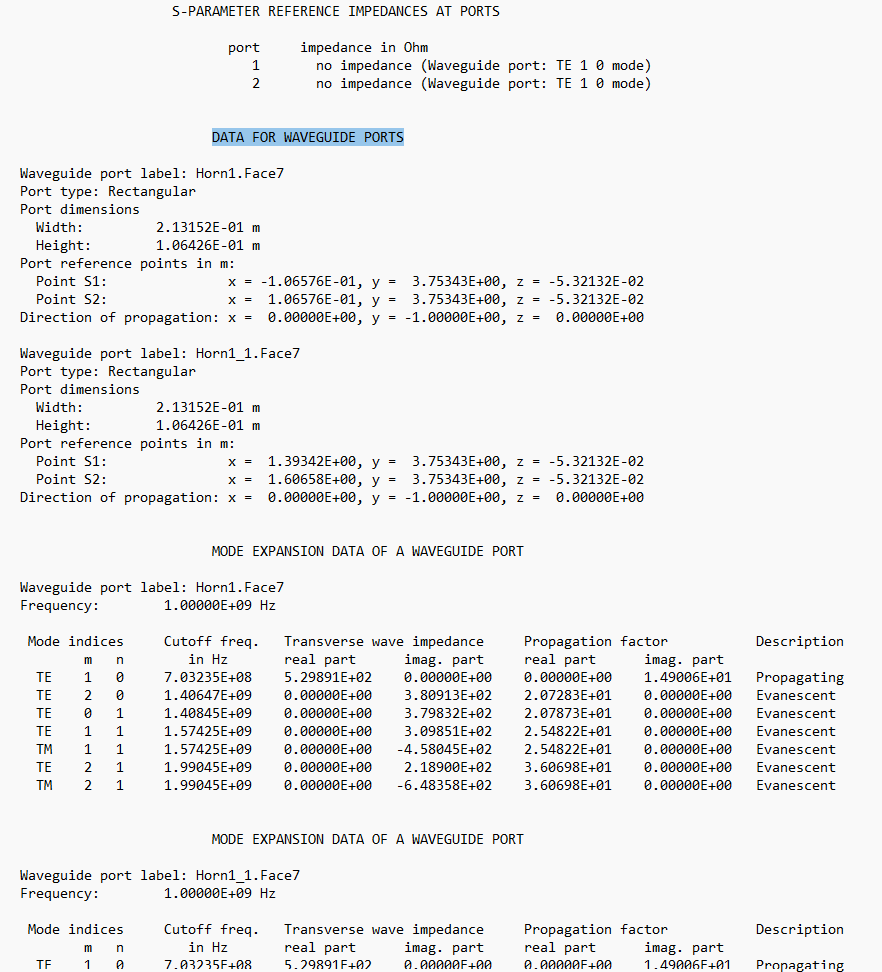
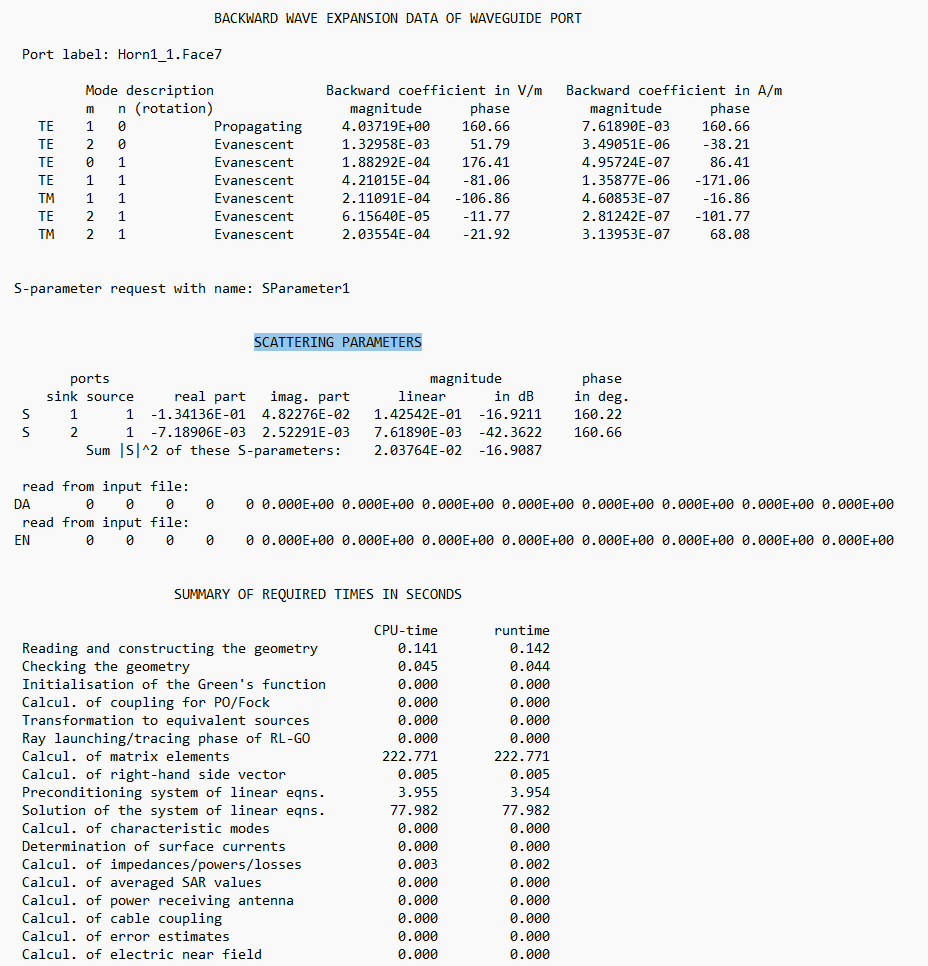
… while power coupling data resides in the Scattering Parameters section. These tables differ in structure, with varying column positions.